
What you can do
-
Cost Tracker (in Project Sheets): inline budgets, area/category filters, and a live delta vs. spend. (Replaces the old Areas Navigator.)
-
Budget Analysis: structured view of Planned Budget, Specification totals, and Purchasing (POs, supplier invoices, client proposals/invoices) with variances.
-
Downloads: export by Areas, Categories, or Suppliers.
Part A — Cost Tracker (Project Sheets)

🔄 Top controls
-
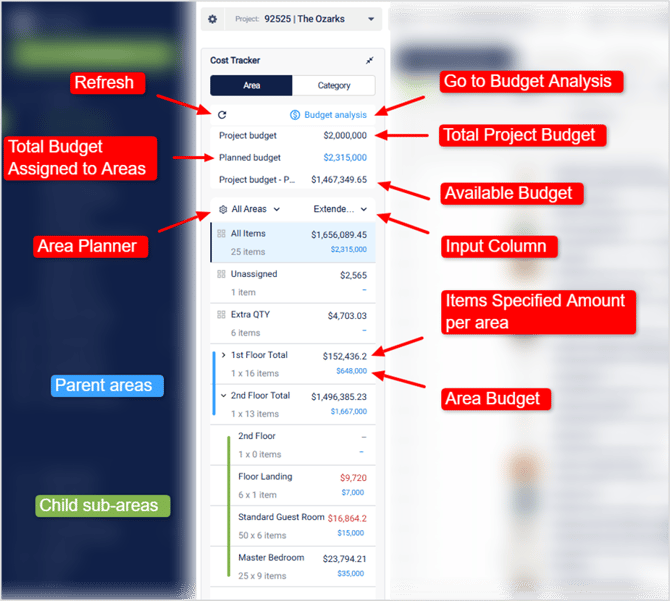
Refresh — recalculates totals after pricing/quantity changes.
- Budget Analysis — opens the full analysis page.
- Area Planner — redirects you to the area planner.
📊 Project budget at a glance
-
Project Budget — the overall project budget you set in Project Settings.
- Planned Budget — the budget you've assigned to your areas in the Budget Analysis or here in the Cost Tracker.
-
Project Budget - POs — quick view of your project available budget. This is calculated based on POs sent, draft POs amounts won't be consider for these calculation.
- Area Budget — Is the budget you have assigned to an specific area in Budget Analysis or in the Cost Tracker.
- Item Specified Amount per Area — Is the sum of the prices for all of the items assigned to a certain area calculated from the input column.
💵 Color coding for Specified Amount per Area
- Black: Area specified amount is doesn't exceeds the area budget amount.
-
Red: Area specified amount exceeds the area budget amount.
Note: Use Refresh to ensure the number reflects your latest data.
🗺 Areas & Categories
-
Switch between Areas or Categories view.
-
Expand a parent (e.g., Second Floor) to see its sub-areas (e.g., Floor Landing, Standard Guest Room, Master Bedroom).
Pro Tip: Click the Settings (gear) in the Cost Tracker → Area Planner to manage area hierarchy (e.g., Floors as parents, Rooms as children).
🧰 Filters
-
All Items — shows totals across the whole project.
-
Unassigned — items not yet assigned to any area.
-
Extra Quantities — isolates additional quantities (e.g., 10% extra on 20 items = 2 extra).
- Areas — Select a specific area to see which items are assigned to this area.
🔢 Quantity views
-
In All Items, you'll see the amount of items in the project, but not their quantities.
-
Select a specific area to see the quantities of each item assigned to that area. Click on the Quantity cell to to view the breakdown.
Part B — Budget Analysis
Open from Project Sheets → Cost Tracker → Budget Analysis or Project Sheets → Budget Analysis (top-right button). The page has three sections:

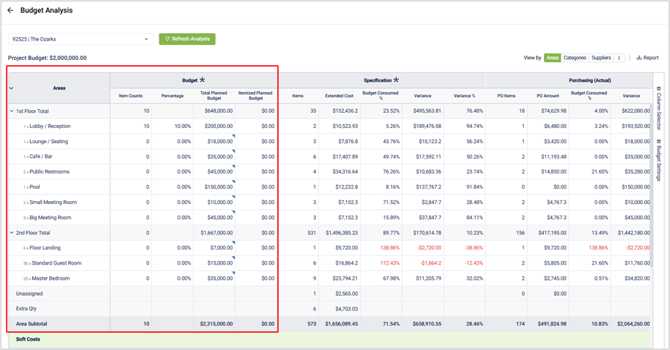
1) Budget (Planning)
-
Item Counts (planned): optional “how many items” target per area.
-
Percentage: set a percentage of the Project Budget for an area (e.g., 10% of $2,000,000).
-
Override Total Plan Budget: enter a specific dollar amount to replace the percentage (A blue mark is going to indicate the percentage has been overridden).
-
Itemized Planned Budget (column mapping): map a Project Sheets column (e.g., Estimated Client Total) to feed planned budgets directly.
Note: The same Areas/Sub-areas structure appears here as in the Cost Tracker for consistent planning.
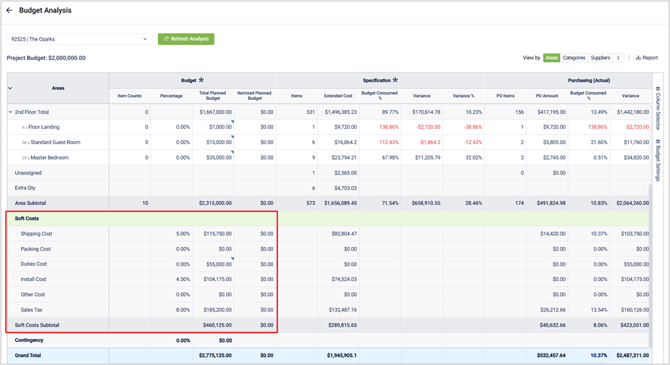
Soft Costs (planned): add shipping, packing/duties, installation, other costs, and sales tax.
-
Enter a percentage (e.g., 1%) to calculate against the total price of all of the items in the project.
- Override any soft cost in the same way as an area budget percentage can be overridden.
2) Specification (Current Spec Totals)
-
Column mapping: choose the cost column (e.g., Extended Cost) that should feed Spec totals.
-
KPIs: Item Counts, Budget Consumed, Variance (amount & % vs. planned budget).
-
Soft Costs (specified): mirrors the planned soft-cost fields using actual spec totals.
Tip: From Budget Settings You can select up to five cost-related columns (e.g., Extended Cost, Estimated Cost, Estimated Client Cost) for fuller visibility.

3) Purchasing (Committed/Actual)
Pulls live totals from procurement documents:
-
PO Amount & Item Counts — per area/category.
-
Supplier Invoice Amount & Counts — actual spend to date.
-
Budget Consumed & Variance — compares invoiced amounts vs. planned budget.
-
Client Proposals/Invoices — show client-facing totals for comparison.
💡Pro tip : If you don't need to see all of the columns related to purchasing or any other section. You can use the Column Selector to hide columns and make your Budget Analysis more compact.

Exporting Reports
From Budget Analysis, download:
-
By Areas — Excel file with the same columns shown in the analysis.
-
By Categories — rollup by category (not by area).
-
By Suppliers — item counts and spend totals per supplier.
Pro Tips
-
Refresh often: After changing quantities, prices, or mappings, hit Refresh in Cost Tracker.
-
Plan first, then map: Start with Planned Budget (percent or override), then map columns for Spec/Purchasing to compare apples-to-apples.
-
Soft-costs strategy: Keep consistent percentages in your soft planning (e.g., shipping 2%) to benchmark planned vs. actual.
-
Area hierarchy pays off: A solid Floor → Room structure makes variance analysis meaningful.
Common Mistakes to Avoid
-
Forgetting column mapping in Budget Analysis → Spec section (totals appear blank or off).
-
Not refreshing after major edits; numbers may appear stale.
-
Mixing plan overrides and percentages without documenting the change—pick one approach per area for clarity.