
Use this feature to build, customize, and share reports that combine data from several projects, helping you make faster, data-driven decisions.
🧭 Overview
The Cross-Project Product Reports module allows you to:
-
Access project data across multiple projects
-
Customize columns, filters, and grouping to refine your view
-
Apply analytics to calculate totals, averages, and other insights
-
Save and duplicate reports for team-wide visibility
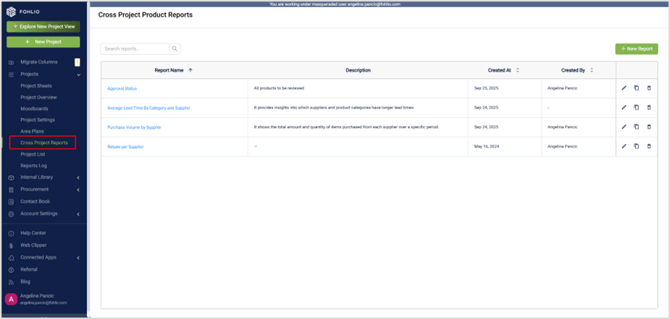
1️⃣ Viewing and Managing Reports
When you open the Cross-Project Reports page, you’ll see a list of all available reports. Each report shows:
-
Report name
-
Description
-
Creator’s name
From this page, you can:
-
Edit a report’s configuration
-
Duplicate an existing report
-
Delete or create a new report
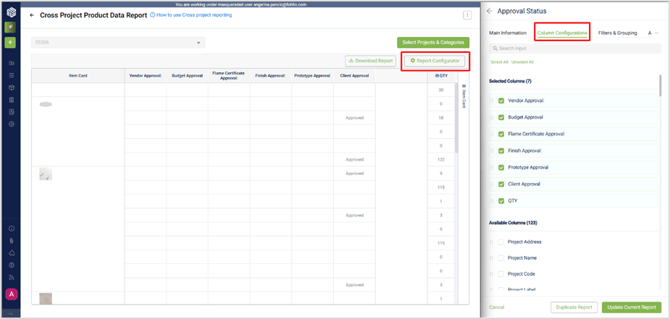
2️⃣ Configuring a Report
Open any report (for example, Approval Status Report) to access the Report Configurator.
Define Basic Details
-
Name – Give your report a clear, descriptive title.
-
Description – Briefly describe its purpose (e.g., “Items pending client review”).
Choose Columns
-
Use the Column Configurations panel to search and select which data fields you want to include.
-
Columns can represent item properties such as project, supplier, price, approval status, or category.
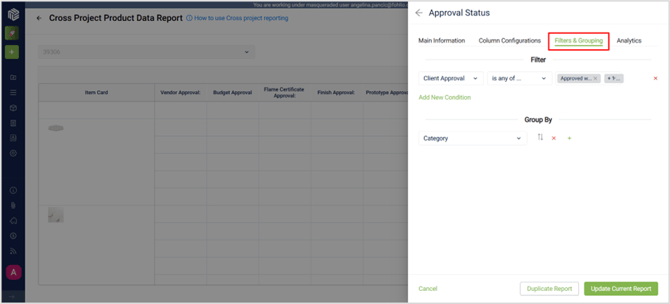
3️⃣ Filters and Grouping
In the Filters and Grouping section, you can tailor your report for specific conditions.
Filters
-
Filter by client approval (e.g., Approved with Comments or Rejected).
-
Add other filters like Product Status, Supplier, or Category to narrow results.
Grouping
-
Group results by Client, Supplier, Category, or Date to spot trends quickly.
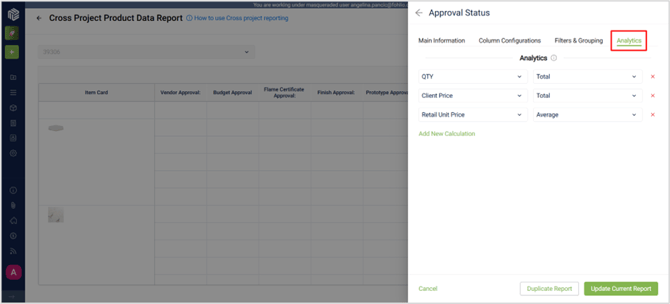
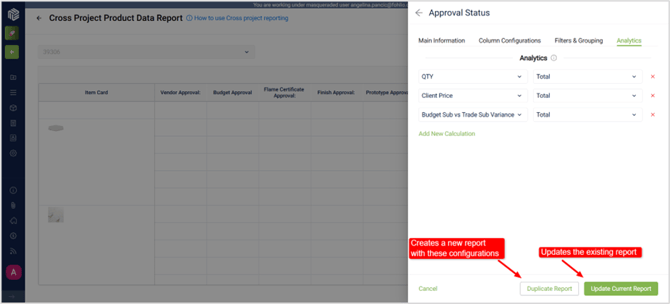
4️⃣ Adding Analytics
You can apply built-in analytics functions to visualize totals and performance metrics.
Examples include:
-
Total Count of Quantity – See how many items fall under each group or status.
-
Total Amount – Calculate cumulative costs per category or supplier.
-
Average Lead Time – Measure efficiency across projects.
Choose your metric (e.g., quantity, total amount, lead time), then select a function such as Sum, Average, or Mean.
Pro tip 💡: Use the analytics section to highlight performance indicators like approval turnaround time or supplier reliability across all projects.
5️⃣Running and Exporting Reports
After applying all configurations:
-
Click Update Report to refresh the results, or Duplicate Report to create a new report with the latest configurations.
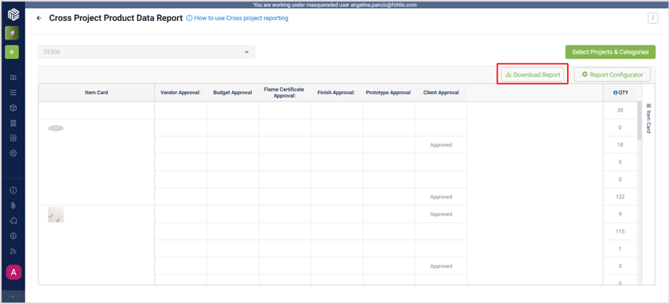
6️⃣Selecting Projects and Categories
Once your report structure is ready, define the scope of your data:
-
Choose which projects to include.
-
Select categories or product types to refine your dataset.

📥 Downloading the Report
You can download your configured report as an Excel file—perfect for sharing, archiving, or running additional calculations. All selected filters, groupings, and columns will be included in the file.
✅ Wrap-Up
The Cross-Project Product Reports tool helps you:
-
Combine data from multiple projects into one report
-
Apply advanced filters and analytics for insights
-
Save and share reusable reports with your team
Experiment with different metrics and filters to find the insights that matter most to your business.
🛠 What’s Next?
Once you’re familiar with Cross Project Reports, try creating multiple saved views for different needs—such as pricing analysis, supplier performance, or regional comparisons. This will speed up your workflow and keep your reporting consistent.
If you have questions, reach out via Live Help.