
🧭 How to Generate the Report
1️⃣ Access the Report
-
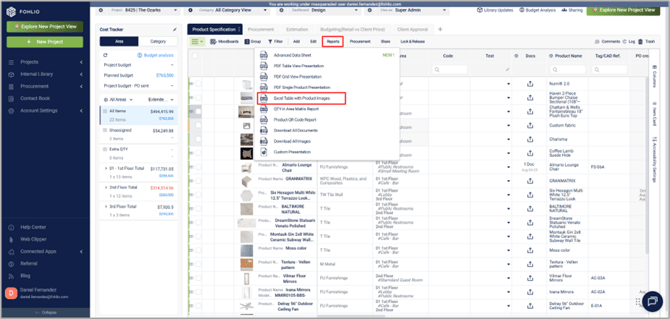
From your Project Sheets, hover over Report Options.
-
Select Excel Table with Product Images.
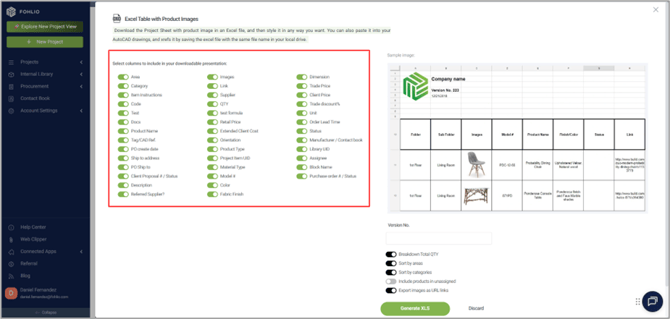
2️⃣ Choose Columns to Include
-
The columns available in your report depend on the phase you are currently viewing in the Project Sheets.
For example:
If you want to include specification-related columns, generate the report while you are in a phase where those specification columns are active.
If you want to include budgeting-related columns, switch to a phase that contains your budgeting columns before generating the report.
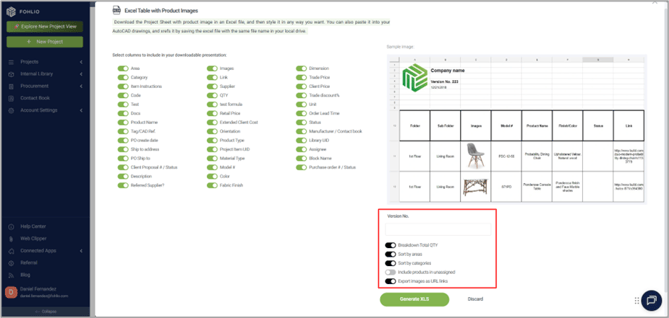
3️⃣ Customize Report Options
You can further tailor the report with several options:
-
Version Number: Add a version label to track report iterations.
-
Include Breakdown Total Quantity: Displays extra quantities as an additional column (e.g., 10% fabric overage).
-
Sort by Areas / Categories: Overrides the default project sheet order and groups items by area or category.
-
Include Unassigned Items: Toggles whether to include products not assigned to any area.
-
Export Images as URL Links: Replaces embedded images with URLs to reduce file size.
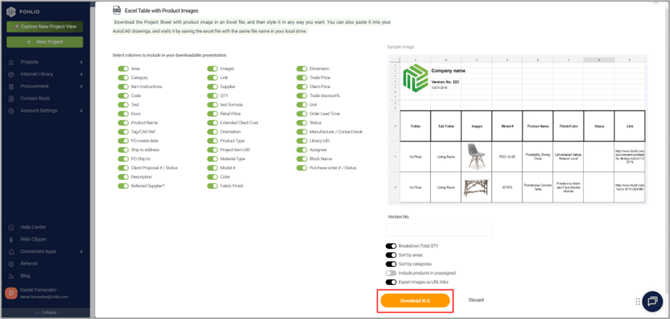
4️⃣ Generate and Download the Report
Once customized:
-
Click Generate XLS to create the report.
-
Click Download XLS the file to review in Excel.
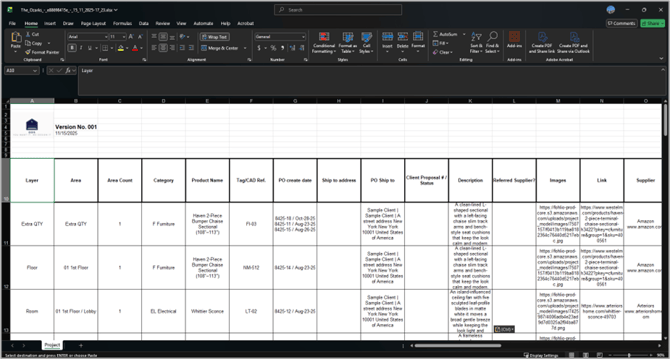
The report includes:
-
Your company logo (from your Fohlio profile).
-
Version number (if provided).
-
Date generated.
-
All data from your selected columns.
- Once you download the Excel file you'll get something like this:
🧾 Working with Pricing Columns
If your report includes pricing data, keep in mind:
-
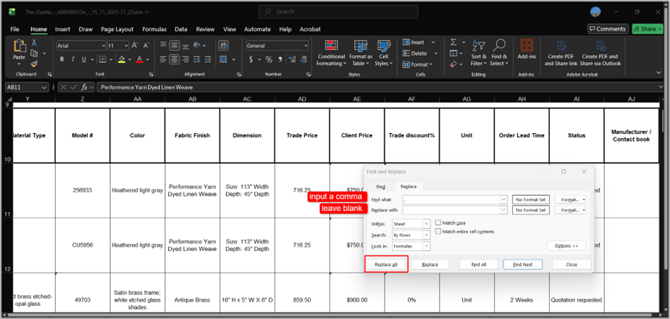
Numbers are exported with thousand separators (commas) — Excel treats these as text, preventing calculations.
To fix this and enable formulas:
-
Press Ctrl + F to open Find and Replace.
-
Click the Replace tab.
-
In Find what, enter a comma (
,). -
Leave Replace with empty.
-
Click Replace All.
Now you can perform math operations normally.
✅ Wrap-Up
The Excel Table with Product Images report helps you:
-
Keep an offline copy of your project data
-
Include product images or URLs
-
Sort, group, and format data as needed
-
Perform calculations after simple formatting adjustments
If you have questions, reach out via Live Help — our team is happy to assist.